
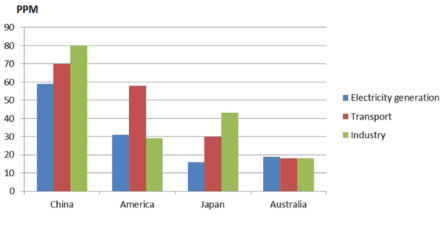
The bar chart delineates the average amount of contamination released into the
air
in four countries namely China, America, Japan and Australia in 2012
Use synonyms
Overall
, it was witnessed that industry was the main cause of Linking Words
air
pollution in four surveyed countries. Use synonyms
Moreover
, China was the most polluted nation throughout the period.
More specifically, it was clear to see that industrial development was the key source that led to Linking Words
air
contamination in China in 2012 with 90 Use synonyms
PPM
, followed by transportation and electricity generation with 70 Use synonyms
PPM
and 60 Use synonyms
PPM
, respectively. Use synonyms
By contrast
, in America, the emissions from means of transport seemed like the main cause of Linking Words
air
pollution with 60 Use synonyms
PPM
, lower than that were the electricity generation and industry with only half than that.
Relating to the remaining features, industrial zones were the crucial factor that polluted the Use synonyms
air
in Japan, with more than 40 Use synonyms
PPM
, Use synonyms
besides
that, transportation held second with lower than 10 Linking Words
PPM
and the Use synonyms
last
was electricity generation. In Australia, it was likely that the levels of Linking Words
air
pollution were gradually caused by all these three factors with nearly 20 Use synonyms
PPM
in 2012Use synonyms