
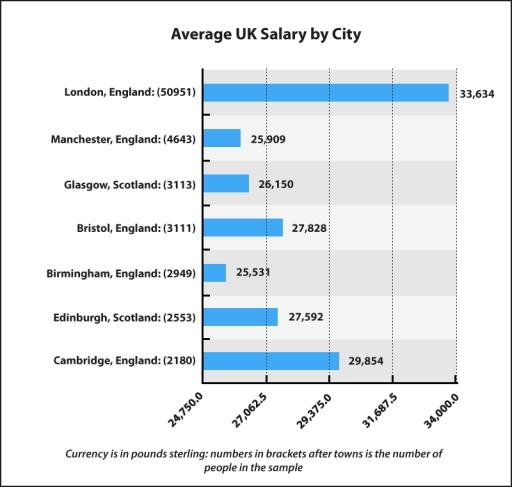
The bar chart provides statistics about how much money is gained by people on average
by
cities in two different countries of the UK. Units are measured in pounds sterling.
Looking from an Change preposition
in
overall
perspective, it is readily apparent that two various cities in England have both the highest and lowest data.
Moving to a more detailed analysis, London has the highest sample numbers and the amount of salary respectively 51000 and 34000, Linking Words
whereas
the figure for Cambridge accounts for the second peak at almost 30000. Bristol and Edinburg experience nearly the same data for wage at approximately 28000 despite the fact that there is a significant difference between them for the number of individuals surveyed, around 3000 for the first and 2500 for the latter.
In terms of other parts of the kingdom, the trend for Glasgow witnesses one of the lowest numbers at slightly over 26000, followed by Manchester and Birmingham for the proportions of income at negligible under 26000. The ratios for people as examples for these three urban areas show noticeable discrepancies, roughly 3000 for Glasgow and Birmingham, compared to 46000 for Manchester.Linking Words