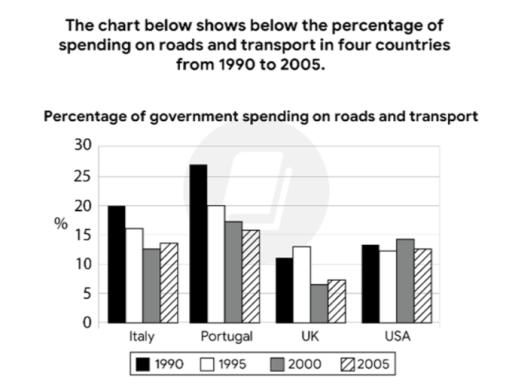
The chart below shows below the percentage of spending on roads and transport in four countries from 1990 to 2005.

The chart below shows below the percentage of spending on roads and transport in four countries from 1990 to 2005.
The bar graph gives
the
Correct article usage
apply
show examples
information about percentage information and different spending on roads and vehicles. In four countries, namely Italy, Portugal, the UK and the USA
Overall
it is clear that
,
Remove the comma
apply
show examples
the amount of Portugal in 1995 showed the highest trend,
while
that of the UK saw the lowest.
According to
the graph, Portugal rose to 25% in 1995, and Italy rose to 20% in 1990. Portugal in 1995 showed the highest trend. The UK rose to 10% in 2000. U.S.A. rose to 15% in 2005- U.S.A. in 2005 showed the highest, but the highest of these is Portugal.
Submitted by hamzayevasamina on

Unauthorized use and/or duplication of this material without express and written permission from this site’s author and/or owner is strictly prohibited. Excerpts and links may be used, provided that full and clear credit is given to Writing9 with appropriate and specific direction to the original content.

Sentences: Add more complex sentences.
Common mistake: Your writing should be 150-250 words.
Vocabulary: The word "graph" was used 2 times.
Vocabulary: The word "showed" was used 3 times.
Vocabulary: The word "information" was used 2 times.
Vocabulary: The word "trend" was used 2 times.
What to do next:
Look at other essays: