
The graph
illustrate
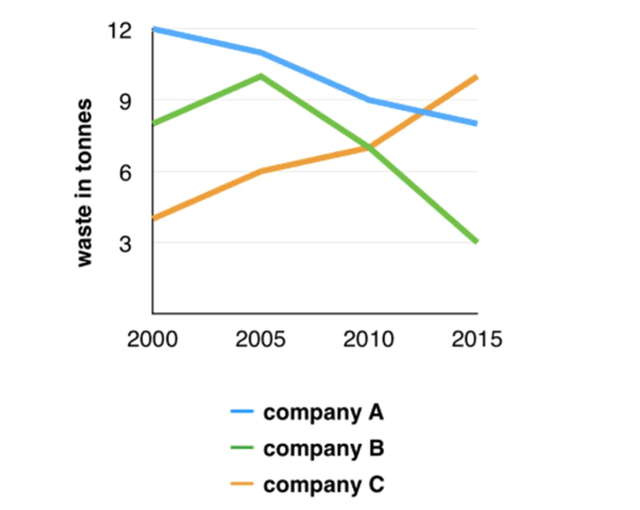
the information about the number of waste supplied by three companies between 2000 and 2015.
In general, what stands out from the graph is that companies A and B experienced a downward trend. In the meantime, there was an upward trend in Change the verb form
illustrates
the
company C throughout the period.
The graph data clearly shows that in 2005 company A was the highest among these three producers. During 2000-2015 it experienced a slight fall to approximately 8 Correct article usage
apply
tonnes
. Use synonyms
Moreover
, firm B witnessed a gradual increase between 2000 and 2005. Linking Words
However
, it dramatically declined from about 10 Linking Words
tonnes
to 7 during the period from 2005-2010. Use synonyms
Then
there was a decrease of almost 4 Linking Words
tonnes
in 2015. Use synonyms
Therefore
, company B was the lowest Linking Words
in
the end of the time.
Change the preposition
at
On the other hand
, producer C was the lowest at the beginning of the process. It climbed to 6 Linking Words
tonnes
from about 4 Use synonyms
tonnes
. Use synonyms
Then
it rose gradually between 2005-2010. Linking Words
Finally
, it saw Linking Words
a
rapid growth in 2015 and it was the highest in 2015.Correct article usage
apply