
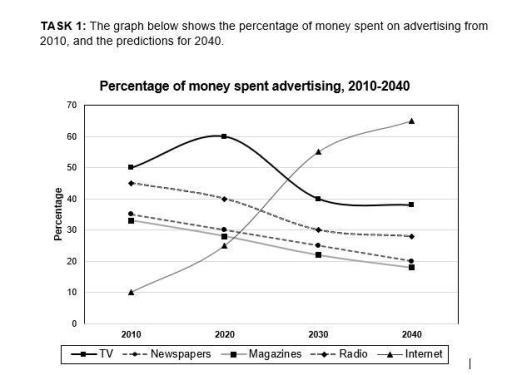
The line graph represents the proportion of expenditure on advertising in one country in terms of five categories namely TV, newspapers, magazines, radio and Internet from 2010 and predicted to 2040.
Overall
, the five categories experienced different trends during the time period, Linking Words
while
the proportion of spending on the Internet gradually increased, other classifications decreased.
As the graph shows, the trend called TV its starting point was more than 35% in 2010, Linking Words
while
the figure experienced growth in 2020 accounting for 45% Linking Words
then
it is predicted that the percentage of TV will fall to 37% in 2040. Regarding the category called newspapers the beginning point was 35% in 2010 followed by a steep decrease to 15% in 2030 continuing with the drop to 10% in 2040. In comparison, magazines and radio were generally stable with minor fall, decreasing from 15% and 10% to 8% and 5%, respectively. Afterwards, the figure will continue to fall in the next two decades. Linking Words
In contrast
, the expenditures with the highest figure showed the Internet recorded the largest expense over the period. Linking Words
This
trend will reach 45% in 2040 starting from 4% in 2010.Linking Words