
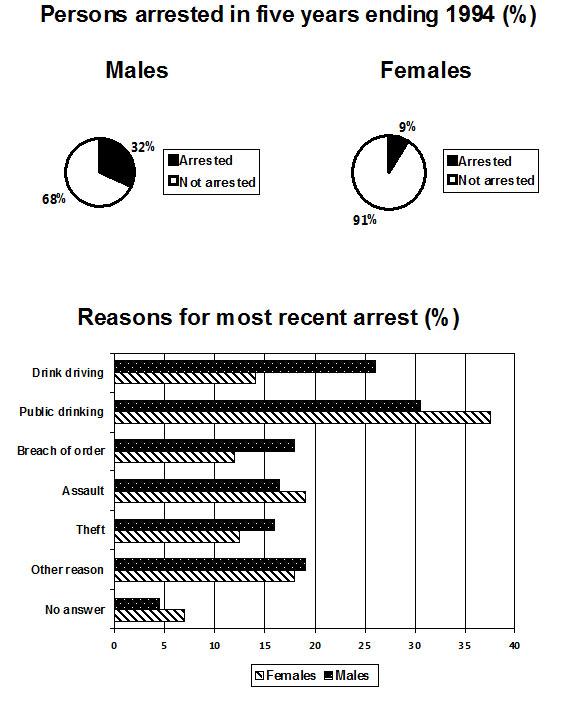
The pie chart illustrates the number of arrested and not arrested people
while
, the bar graph described the percentage of seven different causes to Linking Words
arrest
Use synonyms
male
and females, over the period of five years between Fix the agreement mistake
males
the
1989 and 1994.
Correct article usage
apply
Overall
, males were arrested more than Linking Words
the
Correct article usage
apply
women
and the most common Use synonyms
reason
for the Use synonyms
arrest
is public drinking Use synonyms
while
the least common Linking Words
reason
is not answering for both genders.
The pie chart reveals that 9% of the Use synonyms
women
and 32% of Use synonyms
men
were arrested in a given period of time. Where the bar graph described that the highest number of persons were taken into custody because they were drinking Correct article usage
the men
at
a public place. Drink and Change preposition
in
drive
is the Wrong verb form
driving
second
most common Linking Words
reason
for the Use synonyms
arrest
. Where marginally less than 15% Use synonyms
Use synonyms
women
and slightly more Change preposition
of women
25
% male were taken under custody. No answering is the least Change preposition
than 25
reason
Use synonyms
arrest
to Use synonyms
arrest
in the given time span where only slightly below the 5% Use synonyms
Change preposition
of male
male
and Fix the agreement mistake
males
little
above the Correct article usage
a little
women
were arrested. The rest Use synonyms
all
of the four types (breach of order, Assault, theft and other reasons) percentage fluctuates between 12 per cent and 20 per cent.Correct pronoun usage
apply