
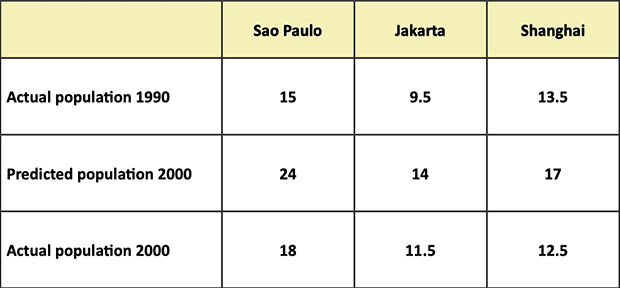
The given table indicates actual and estimated
figures
for Use synonyms
citizens
in three various Use synonyms
cities
, namely Use synonyms
Sao
Use synonyms
Paulo
, Use synonyms
Jakarta
and Shanghai in the years 1990 and 2000.
Use synonyms
Overall
, it is obvious that the Linking Words
number of
Correct quantifier usage
apply
actual
Add an article
the actual
population
in 1990 was lower than the number of that in 2000 in the two Use synonyms
cities
Use synonyms
Sao
Use synonyms
Paulo
and Use synonyms
Jakarta
. The Use synonyms
figures
for predicted Use synonyms
citizens
in 2000 were much higher than the Use synonyms
figures
for Use synonyms
citizens
in fact in all three Use synonyms
cities
shown.
Use synonyms
To begin
with, Linking Words
actual
Add an article
the actual
population
in Use synonyms
Sao
Use synonyms
Paulo
and Use synonyms
Jakarta
in 1990 was 15 Use synonyms
million
Use synonyms
people
and 9.5 Use synonyms
million
Use synonyms
people
respectively, they were lower than Use synonyms
actual
Add an article
the actual
population
in 2000 in these two Use synonyms
cities
. Use synonyms
While
Linking Words
,
the figure for Remove the comma
apply
actual
Add an article
the actual
an actual
population
in Shanghai in 1990 was 13.5 Use synonyms
million
Use synonyms
people
, it was higher than the figure for Use synonyms
actual
Add an article
the actual
an actual
population
in 2000, with only 12.5 Use synonyms
million
Use synonyms
people
.
In 2000, the number of predicted Use synonyms
citizens
in Use synonyms
Sao
Use synonyms
Paulo
was the highest, with 24 Use synonyms
million
Use synonyms
people
, but, in fact, Use synonyms
Sao
Use synonyms
Paulo
only had 18 Use synonyms
million
Use synonyms
people
. The Use synonyms
figures
for estimated Use synonyms
citizens
in Use synonyms
Jakarta
and Shanghai were much higher than the Use synonyms
figures
for Use synonyms
citizens
in fact, 14 and 17 Use synonyms
million
Use synonyms
people
compared to 11.5 and 12.5 Use synonyms
million
Use synonyms
people
.Use synonyms