
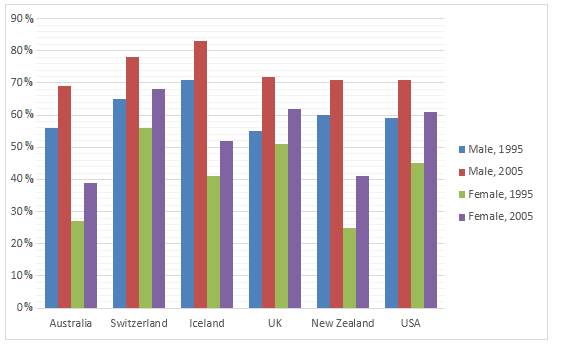
The bar chart illustrates the percentages of men and women employees in
Australia
, Use synonyms
Switzerland
, Use synonyms
Iceland
, Use synonyms
UK
, New Correct article usage
the UK
Zealand
and Use synonyms
Use synonyms
USA
over a 10-year period from 1995 to 2005.
Correct article usage
the USA
Overall
, the male and female workers experienced upward trends throughout the period. In all the Linking Words
countries
the employment rates had Use synonyms
a
Correct article usage
apply
rise
and Wrong verb form
risen
fall
.
In 1995, there were about 55% and 65% of masculine employees in Wrong verb form
fallen
Australia
and Use synonyms
Switzerland
respectively. Use synonyms
However
, in Linking Words
Use synonyms
Iceland
the adult male workers were the highest when compared to other given Add a comma
,Iceland
countries
with 70%, but Use synonyms
this
percentage in New Linking Words
Zealand
and Use synonyms
Use synonyms
USA
was almost the same. Correct article usage
the USA
Moreover
, in 2005 the masculine wage-earners had crossed three-fifths of the total employment in all Linking Words
the
six Correct article usage
apply
countries
with approximately 69% and 79% in Use synonyms
Australia
and Use synonyms
Switzerland
, Use synonyms
while
in Linking Words
Iceland
it is almost 82%. Use synonyms
Finally
, in New Linking Words
Zealand
and Use synonyms
Use synonyms
Correct article usage
the USA
USA
the men workers are recorded Add a comma
,USA
70
% each.
Change preposition
at 70
Secondly
, the female Linking Words
employee
rates in 1995 were about 27% in Replace the word
employment
Australia
and almost 56% in Use synonyms
Switzerland
. Use synonyms
Whereas
in Linking Words
Iceland
and Use synonyms
UK
it was noted as 40% and 50% respectively. In New Add a comma
,UK
Use synonyms
Zealand
just 23% of women are employed, Add a comma
,Zealand
while
Linking Words
the
Change preposition
in the
USA
Use synonyms
had
roughly 45% of them. Unnecessary verb
apply
Moreover
, in 2005 Linking Words
the
feminine labour participation Correct article usage
apply
had
sharply increased in all the Unnecessary verb
apply
countries
.Use synonyms