
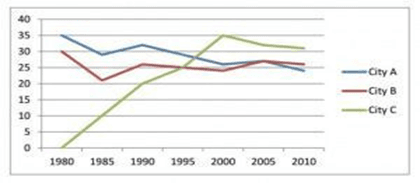
The line graph compares the
number
of international Use synonyms
conferences
held in three different capital cities during the Use synonyms
year
1980 to 2010.
Use synonyms
Overall
, Linking Words
it is clear that
the Linking Words
number
of Use synonyms
conferences
held in Use synonyms
City
A and Use synonyms
City
B Use synonyms
was
gradually decreased. Unnecessary verb
apply
However
, in Linking Words
City
C a rapid increase in organizing international Use synonyms
conferences
can be seen until the Use synonyms
year
2000.
Use synonyms
Initially
, in the Linking Words
year
1980, both Use synonyms
the
cities were organizing Correct article usage
apply
the
different Correct article usage
a
number
of international Use synonyms
conferences
, 35 in Use synonyms
City
A and 30 in Use synonyms
City
B. Use synonyms
However
, a rapid change between Linking Words
Linking Words
this
two cities can be seen in organizing Correct determiner usage
these
conferences
until 2005 when they both held an equal Use synonyms
number
of Use synonyms
conferences
, Use synonyms
that is
around 27. Interestingly, by the end of the period, Linking Words
City
B has organized more events than Use synonyms
City
A, 26 and 24 respectively.
Use synonyms
In contrast
, Linking Words
City
C had not organized any international conference in the Use synonyms
year
1980, Use synonyms
this
Linking Words
city
seeing Use synonyms
the
Correct article usage
apply
number
20, in the total Use synonyms
number
of meetings in the Use synonyms
year
1990. Use synonyms
Moreover
, Linking Words
this
growth is Linking Words
further
extended until the Linking Words
year
2000 when Use synonyms
City
C Use synonyms
has
organized the highest Unnecessary verb
apply
number
of Use synonyms
conferences
(35), after that, by the end of the period they organized a total of around 31 Use synonyms
such
Linking Words
conferences
marking them the topmost hosting Use synonyms
city
.Use synonyms