
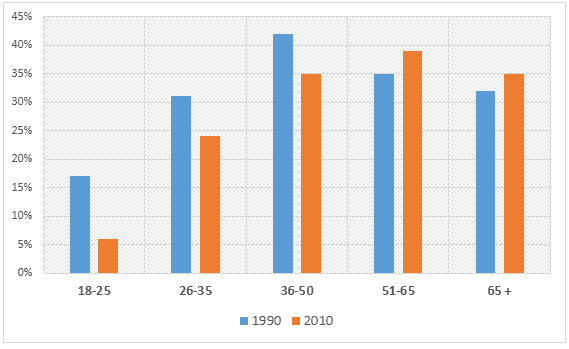
The chart examines the levels of donation among people of different ages in Britain.
Overall
, a greater percentage of British people gave money to charity in 1990 than in 2010. Linking Words
However
, across the two years, the pattern differs before and after the age of 50.
In 1990, 42% of the 36-50 Linking Words
age-group
made charitable donations, and Correct your spelling
age group
this
figure is the highest on the chart. The 18-25s contributed the least at only 17%. By 2010, these figures had fallen significantly to 35% and 7% respectively. The level of donations from the 26-35 Linking Words
age-group
Correct your spelling
age group
also
experienced a decrease in 2010 from 31% to 24%.
Linking Words
While
donations up to the age of 50 declined across the two years, they rose among the 51-65 Linking Words
age-group
from 35% to nearly 40, which was the highest percentage for 2010. The figure for the over 65s was lower than Correct your spelling
age group
this
, at 35%, but it was still a little higher than the 1990 figure of 32%.Linking Words