
The charts above discuss two different
Correct quantifier usage
pieces of informations
informations
that we can analyze Correct your spelling
information
togheter
. They show us the results of a survey which asked questions to United Kingdom Correct your spelling
together
people
about a variety of reasons to travel, and the most searched places to travel within Use synonyms
a
period Correct article usage
the
to
1994 - 1998.
The first Change preposition
from
chart
demonstrates that during the Use synonyms
questioned
period Replace the word
question
people
chose to travel for holiday Use synonyms
purpose
(an average of 17,700 Fix the agreement mistake
purposes
people
) and the highest amount of Use synonyms
people
that Use synonyms
traveld
for holidays was 20,700 in 1998. Different Correct your spelling
travelled
travel
of
that the Change preposition
from
chart
shows that there are a few Use synonyms
amount
of Change to a plural noun
amounts
people
that Use synonyms
traveld
for Correct your spelling
travelled
travel
others
reasons Correct quantifier usage
other
such
as business and to visit friends or relatives (Linking Words
is
was around 5,500 Correct your spelling
it
people
).
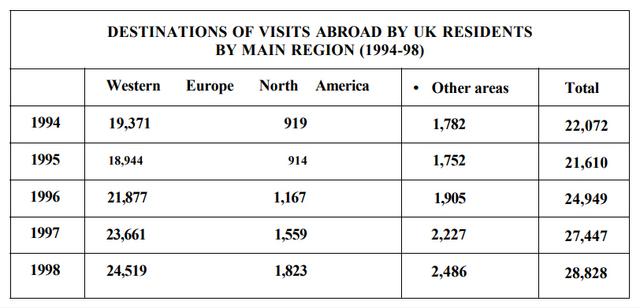
The Use synonyms
second
Linking Words
chart
Use synonyms
on the other hand
detailed the information which is the most chosen places within the same period discussed Linking Words
on
the paragraph above. As we can see on the Change preposition
in
chart
the most visited place was Western Europe, Use synonyms
situation
that repeated all years, followed by others areas. An interesting Add an article
a situation
information
noticed is that the Correct quantifier usage
piece of information
last
chosen place was North America.
By reading the information released in these charts we can see that Linking Words
the
most Correct article usage
apply
people
came from Use synonyms
UK
rather trips inside the European continent for spent their Correct article usage
the UK
relax
times, than explore different continents around the world.Change the form of the verb
relaxing