
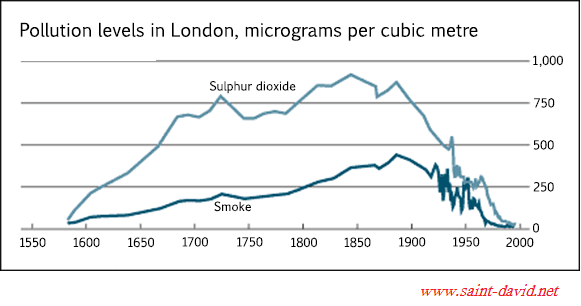
The graph shows pollution
levels
in London between 1600 and 2000. It measures Use synonyms
smoke
and Use synonyms
sulphur
Use synonyms
dioxide
in Use synonyms
micrograms
per cubic metre. Use synonyms
According to
the information, the Linking Words
levels
of both pollutants formed a similar pattern during Use synonyms
this
period, but there were always higher Linking Words
levels
of Use synonyms
sulphur
Use synonyms
dioxide
than Use synonyms
smoke
in the atmosphere.
(2nd paragraph describes the trends in more detail and illustrates these using data from the graph.)
In 1600, pollution Use synonyms
levels
were low, but over the Use synonyms
next
hundred years, the Linking Words
levels
of Use synonyms
sulphur
Use synonyms
dioxide
rose to 700 Use synonyms
micrograms
per cubic metre, Use synonyms
while
the Linking Words
levels
of Use synonyms
smoke
rose gradually to about 200 Use synonyms
micrograms
per cubic metre. Over the Use synonyms
next
two hundred years the Linking Words
levels
of Use synonyms
sulphur
Use synonyms
dioxide
continued to increase, Use synonyms
although
there was some fluctuation in Linking Words
this
trend. They reached a peak in 1850. Linking Words
Smoke
Use synonyms
levels
increased a little more sharply during Use synonyms
this
time and peaked in 1900 at about 500 Linking Words
micrograms
. During the 20th century, the Use synonyms
levels
of both pollutants fell dramatically, though there was a great deal of fluctuation within Use synonyms
this
fall.
(Final paragraph draws a simple conclusion from the data.)
Linking Words
Clearly
air pollution was a bigger problem in London in the early 20th century than it is now.
(176 words)Add a comma
,Clearly