
This
diagram represents the way used by the Australian Bureau of Meteorology to predict the weather. Linking Words
Overall
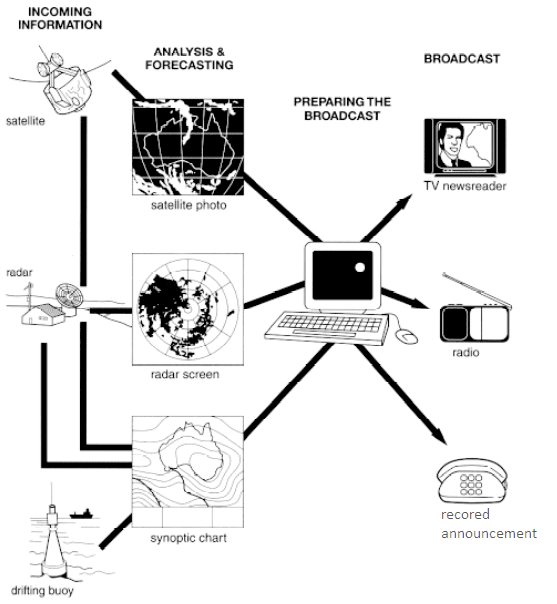
, the process consists of four stages, beginning with incoming information and ending up with the broadcast.
First of all, we can see that the information about the weather is collected from three different sources, namely, satellite, radar and drifting buoy, Linking Words
then
, the data from the satellite is analysed in the satellite photo, radar screen and even in a synoptic chart, Linking Words
while
the information from the radar is analysed in sonar screen and synoptic chart, Linking Words
in addition
, the raw data from the drifting buoy is analysed only in the synoptic chart.
After that, all the results from the previous stage are fed into a computer system to prepare the broadcast.
Linking Words
Finally
, the climate forecasts are ready to transmit to the radio, TV newsreader or as a recorded announcement.
Linking Words
To sum up
, the data about weather prediction have to be done in sequence in order to be reliable.Linking Words