
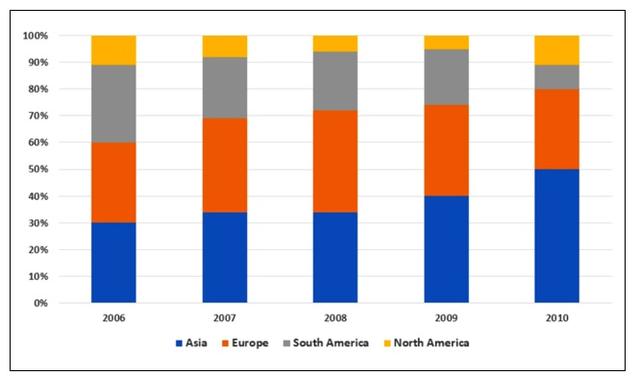
The figure provided reveals the data about the
proportion
of cars sold in four different regions, over Use synonyms
the
five consecutive years, starting from 2006.
Correct article usage
apply
Overall
, it can be seen from the bar chart that the Linking Words
proportion
of cars sold increased significantly in Asia, Use synonyms
while
the opposite was true in South Linking Words
America
and Europe. Use synonyms
Additionally
, the percentage of North Linking Words
America
remained stable over the given Use synonyms
period
.
It's clear from the figure that the Use synonyms
proportion
of sales in Asia rose significantly over the given Use synonyms
period
, and by 2010, Use synonyms
it's
percentage Correct your spelling
its
has
doubled and shows 50%. Wrong verb form
had
By contrast
, the percentages of sales in Europe and South Linking Words
America
declined during the given Use synonyms
period
, showing 35% and 29% in 2006, their Use synonyms
proportion
had dropped considerably to 30% and 9% respectively. With regards to North Use synonyms
America
,Use synonyms
it's
percentage remained steady at 11% during the Correct your spelling
its
period
.Use synonyms