
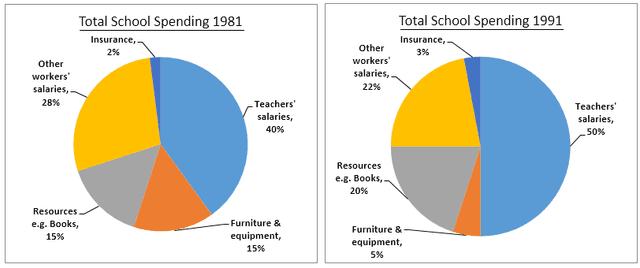
The changes in expenditure purposes every year of a particular UK school are illustrated in three pie charts following
three
years 1981, 1991 and 2001. All figures are measured in percentage.
It can be clearly seen from the pie charts that Correct article usage
the three
teacher’s
salaries had always been Fix the agreement mistake
teachers’
counting
for the majority meanwhile insurance occupied the lowest rate in total Wrong verb form
counted
expense
.
During the two decades, the proportion of insurance spending went up dramatically; noticeably, the figure in 2001 was four times as much as the one in 1981. Fix the agreement mistake
expenses
On the contrary
, the rate of other workers’ salaries underwent a downward trend to only Linking Words
a
half at the beginning of Correct article usage
apply
21th
century.
Change the ending
21st
Besides
, both resources e.g. books and teachers’ salaries observed slight increases between 1981 and 1991 and drops in 2001. Linking Words
In contrast
, the amount of furniture and equipment expenditure fell rapidly in the first decade and Linking Words
then
soared in Linking Words
Linking Words
next
10 years.Correct article usage
the next