
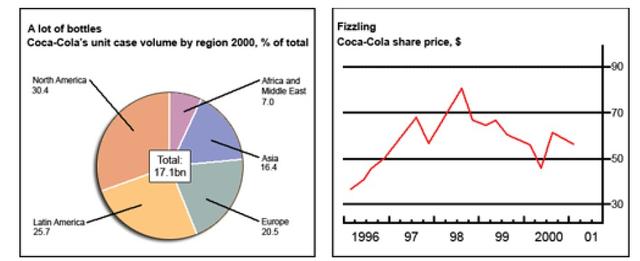
The Pie-chart and Bar graph combinedly enumerate the total Coca-Cola sales in six different continents and share prices starting from 1996 to 2001.
Overall
, North Linking Words
America
and Latin Use synonyms
America
hold the highest proportion in the chart compared with other regions. On the other side the share prices for the brand Coca-Cola fluctuated over four years.
The Majority of sales were accounted by North Use synonyms
America
about less than a Use synonyms
third
followed by Latin Linking Words
America
with a quarter share. Use synonyms
Similarly
, Europe and Asia have contributed 20.5%, Linking Words
16.4
% respectively. Africa and Correct word choice
and 16.4
Middle
East have counted the least of 7.0% which is less than a one in ten proportion.
At the beginning of the period 1996, the shares were recorded the least about $36. Where it had a significant rise over the year 1997 it made around $70 followed by a dip in the mid of the year and faced an erratic movement for years. In the end, it maintained Correct article usage
the Middle
around
$60 in 2001.Change preposition
at around