
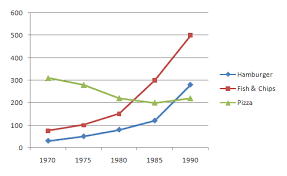
The line graph indicates alterations in the quantity and variety of junk food ingested by Australian youth that occurred during a
25 year
period.
It is interesting to mention that the aggregate of Add a hyphen
25-year
pizza
and Use synonyms
hamburgers
Use synonyms
were
improved, Correct subject-verb agreement
was
although
the utilization of chips and fish experienced a plunge over the period. But they are all finished at Linking Words
the
equal level.
As the pie chart shows, the most trendy meal among adolescents Correct article usage
an
were
fish and chips. Change the verb form
was
Comparing
to another it was eaten 5 times more in 1975th. After witnessing a fall, a gradual went up is clearly seen. Wrong verb form
Compared
However
, it Linking Words
is
dramatically dropped after a slight growth, which is mentioned in 1985.
In considerable contrast to Unnecessary verb
apply
this
, teens ate Linking Words
pizza
and Use synonyms
hamburgers
at higher levels. Use synonyms
Pizza
consumption has risen insensibly since 1975 and remain constant since 1995th. Speaking of the expenditure Use synonyms
of
Change preposition
on
hamburgers
, Use synonyms
nevertheless
Linking Words
by contrast
to Linking Words
pizza
it saw a sharp improvement at the beginning. Use synonyms
Likewise
, Linking Words
hamburgers
stabilized from Use synonyms
Correct article usage
the 1990’s
1990’s
to 2000 after a substantial upward trend, the same as Fix apostrophe usage
1990s
pizza
.Use synonyms