
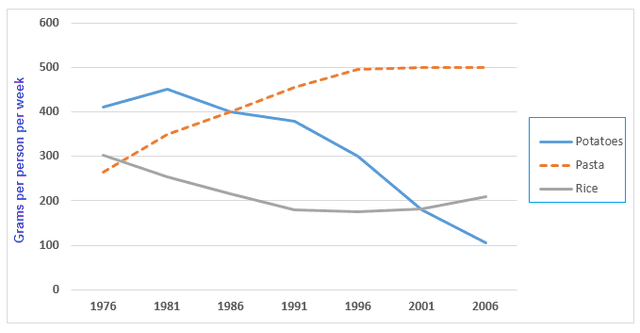
The given illustration below compares European country citizen's eaten
amount
of 3 food products: potatoes, rice and pasta, from 1976 till 2006.
As it shows during the first 10 years potatoes showed Add an article
the amount
high
rise. The highest gram was above 450 Add an article
a high
grams
per person per week. Use synonyms
However
between 2001 and Linking Words
2008
the number slowed down, and it is marked as the lowest, about 180 and 110 Add a comma
,2008
grams
.
Use synonyms
In
Linking Words
contrast
the amount of pasta started with Add a comma
,contrast
low
position(250 Correct article usage
a low
grams
) and began to rise following 20 years. From 1996 till 2006 Use synonyms
this
food product is keeping its highest score(500 Linking Words
grams
per person per week). Use synonyms
However
in European Linking Words
country
rice was not eaten much, in comparison Fix the agreement mistake
countries
of
previous products. The highest volume of eaten rice contains approximately 300 Change preposition
to
grams
, Use synonyms
while
the lowest score showed only about 150 Linking Words
grams
in 1999.
Use synonyms
To sum up
, in European countries Pasta is eaten more (Linking Words
800grams
) than the other two products, which showed only 450 and 310 Correct your spelling
800 grams
of
Change preposition
apply
high
Add an article
a high
the high
score
.Fix the agreement mistake
scores