
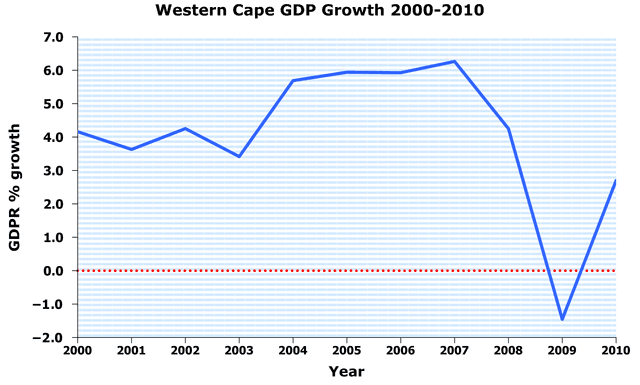
The given line graph demonstrates the various percentages of Gross Domestic
product
(Change the capitalization
Product
GDP
) over a decade in the Western Cape. Use synonyms
Overall
, there are lots of ups and downs Linking Words
are
seen in Unnecessary verb
apply
GDP
from 2000 to 2010.
There was Use synonyms
the
fluctuation Correct article usage
a
of
Change preposition
in
GDP
growth between 2000 to 2003 with Use synonyms
the
scale Correct article usage
a
around
4 Change preposition
of around
percent
. In 2004, it Change the spelling
per cent
then
showed a sharp increase in Linking Words
GDP
Use synonyms
in
5.5 Change preposition
by
percent
. Change the spelling
per cent
In addition
, the Linking Words
GDP
growth was steady in Use synonyms
Linking Words
next
four years with slowly rose to reach Correct article usage
the next
at
peak Correct your spelling
a
to
over 6 % in 2007. Following the highest point, the Change preposition
of
GDP
dropped down dramatically and touched its lowest point which was a negative figure (-1.5 %) in 2009. Use synonyms
Afterward
, it again suddenly jumped to 2.5% of Change the spelling
Afterwards
Use synonyms
GDP
Correct article usage
the GDP
Linking Words
next
year.
Correct article usage
the next
To sum up
, it clearly demonstrated from the graph that Linking Words
although
it was a positive trend in the first few years, Western Cape Linking Words
also
experienced negative Gross Domestic Product (Linking Words
GDP
) growth.Use synonyms