
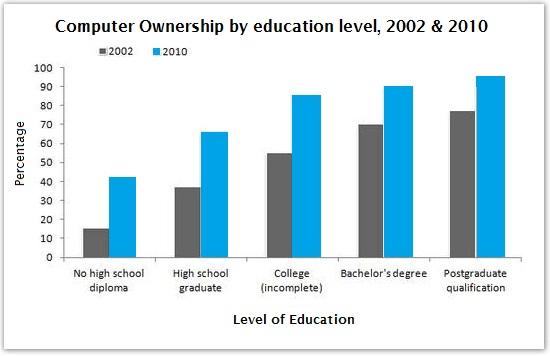
The given bar graphs show data on the
percentage
of the year 2002 to 2010 both Use synonyms
by comparison
of total population and education level. As is observed from the given graphs, Linking Words
the
computer Correct article usage
apply
ownership
increased over the Use synonyms
years
and Use synonyms
this
Linking Words
ownership
among the Use synonyms
people
with higher studies was higher than others.
Use synonyms
According to
the first graph, more than 50% Linking Words
Use synonyms
people
owned Change preposition
of people
computers
in 2002 and Use synonyms
this
Linking Words
percentage
kept on increasing over the Use synonyms
years
. After 6 Use synonyms
years
, Use synonyms
thisthis
Correct your spelling
this this
percentage
reached Use synonyms
to
over 60% and Change preposition
apply
finally
in 2010 the Linking Words
percentage
of Use synonyms
people
who owned Use synonyms
computers
reached Use synonyms
to
over 70%.
From the Change preposition
apply
second
bar graph, we can observe that the Linking Words
percentage
of computer Use synonyms
ownership
increased with the education level; i.e. the higher the education level the higher the Use synonyms
percentage
of computer Use synonyms
ownership
. Use synonyms
For instance
, 15% of the Linking Words
people
who had High school Use synonyms
graduation
owned Replace the word
graduated
computers
in 2002 and Use synonyms
this
Linking Words
percentage
Use synonyms
were
about 60 for bachelor’s degree holders and over 80 for Correct subject-verb agreement
was
the
postgraduate degree holders. After 8 Correct article usage
apply
years
, in 2010, the same trend could be observed and the Use synonyms
percentage
of Use synonyms
people
who owned Use synonyms
computers
increased significantly compared to 2002.Use synonyms