Task 1 : The pie charts below describe the electric energy production a major source of energy in the US. Write a short report for a university lecturer describing the information in the charts

Task 1 : The pie charts below describe the electric energy production a major source of energy in the US. Write a short report for a university lecturer describing the information in the charts
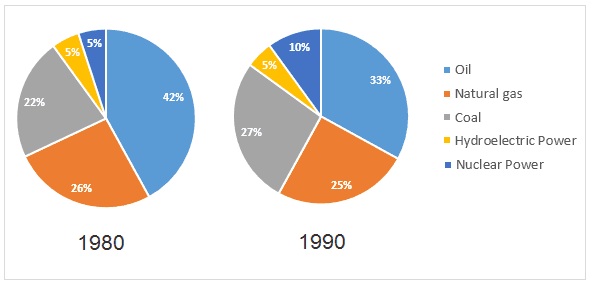
The two pie charts reveal the ratio of the five particular types of electric
energy
production in the United State in 1970 and 1980. At the onset, it is apparently seen that the ratio of coal and nuclear grew markedly
whereas
others declined. Now, turning to the details: Coal occupied the highest percentage of the electiric
energy
production in five major sources of
energy
during these ten years: rising from 47 % in 1970 to 51 % in 1980. The ratio of hydro in 1980 was three quarters times as high as that of hydro in 1970 (12 % compared with 16 %). The percentages of oil in 1970 and 1980 were roughly similar, 12 % and 11 % respectively.
Conversely
, there was a considerable growth in the percentage of nuclear from 1970 to 1980, increasing from 1% to 11%. Natural gas
also
experienced a gradual fall in the proportion of the eclectric
energy
production, from 24 % in 1970 to 15 % in 1980.
Submitted by Andy on

Unauthorized use and/or duplication of this material without express and written permission from this site’s author and/or owner is strictly prohibited. Excerpts and links may be used, provided that full and clear credit is given to Writing9 with appropriate and specific direction to the original content.

Sentences: Add more complex sentences.
Introduction: The introduction is missing.
Introduction: Change the first sentence in the introduction.
Introduction: The chart intro is missing.
Vocabulary: Replace the words energy with synonyms.
Vocabulary: The word "percentage" was used 3 times.
Vocabulary: The word "ratio" was used 3 times.
What to do next:
Look at other essays: