
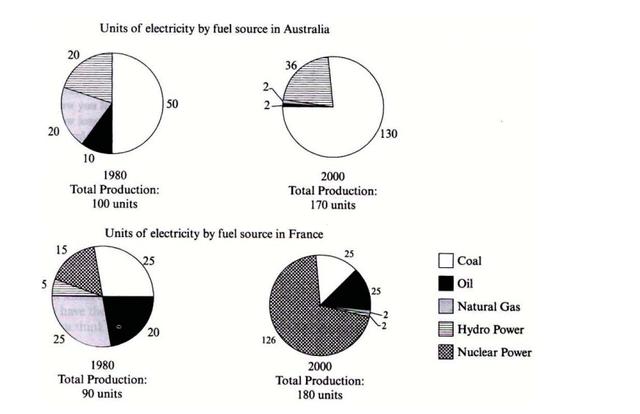
The pie charts illustrate the total manufacture of
electricity
measured in Use synonyms
group
and divided by different Fix the agreement mistake
groups
fuel
Use synonyms
sources
in Australia and Use synonyms
France
in 1980 and 2000.
Use synonyms
Overall
, it is clearly shown that significant Linking Words
fuel
Use synonyms
sources
used in Use synonyms
electricity
Use synonyms
production
were different in Australia and Use synonyms
France
.
First of all, there were considerably more Use synonyms
electricity
Use synonyms
units
produced in Australia in 2000 (170 Use synonyms
units
) than in 1980 (100 Use synonyms
units
). The majority of service produced in Australia for both years was from coal, but there was a higher dependency on coal in Use synonyms
electricity
Use synonyms
production
in 2000 than in 1980 (130 out of 170 and 50% respectively). There was an increase of 16 Use synonyms
units
of Use synonyms
electricity
produced by hydropower from 1989 to 2008 Use synonyms
whereas
Linking Words
the
other Correct article usage
apply
sources
like natural gas and oil contributed less to Use synonyms
electricity
Use synonyms
production
in 2000 than in 1980.
Turning to Use synonyms
France
's Use synonyms
fuel
Use synonyms
sources
, it is apparent that Use synonyms
electricity
Use synonyms
production
doubled in 2000 Use synonyms
than
in 1980, which was 180 for the former and 90 for the latter. The most striking feature is that only 15 out of 90 Change preposition
apply
units
were produced by nuclear power in 1980. Use synonyms
However
, it became the primary Linking Words
fuel
source of Use synonyms
electricity
Use synonyms
production
in Use synonyms
France
in 2000, 70%. Not forgetting to mention that other Use synonyms
fuel
Use synonyms
sources
in Use synonyms
electricity
Use synonyms
production
became less in 2000 than in 1980.Use synonyms