
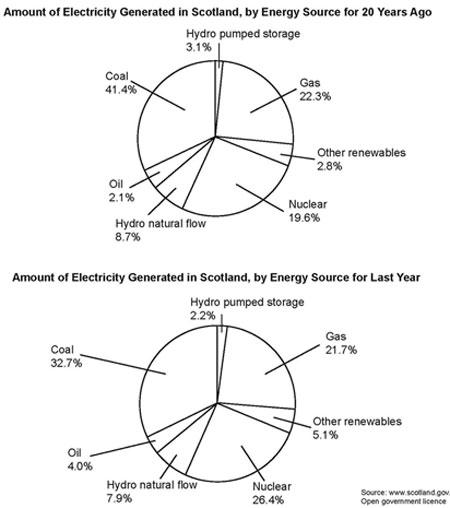
The above-highlighted
pie
charts illustrate, the percentage of Use synonyms
power
produced in Scotland. The two different Use synonyms
pie
charts exhibit the Use synonyms
amount
of Use synonyms
electricity
produced by seven different kinds of Use synonyms
resources
in the past 2 decades and Use synonyms
last
Linking Words
year
.
The first Use synonyms
pie
chart depicts Use synonyms
the
information about Correct article usage
apply
electricity
manufactured by Use synonyms
resources
two decades ago. Use synonyms
In particular
, coal Linking Words
had
generated the highest quantity of Unnecessary verb
apply
power
with 41.4 % . Gas was the Use synonyms
second
main source of Linking Words
resources
with average electric production of 22.3 % which is 19.1 % lesser than Coal. Nuclear was considered Use synonyms
as
the Change preposition
apply
third
with a total Linking Words
amount
of 19.6 % of Use synonyms
energy
. The other kind of Use synonyms
energy
resource was able to produce less than 10 % of Use synonyms
Electricity
, where Use synonyms
oil
was marked as the lowest capability to generate Use synonyms
electricity
with an average of 2.1 % in the past 2 decades.
The record Use synonyms
also
proved that Scotland had used the same features for Linking Words
producing
in the past Replace the word
production
year
. Use synonyms
In contrast
, to the other kind of sources, coal Linking Words
had
generated the highest Unnecessary verb
apply
power
with the highest Use synonyms
amount
of 32.7 % of Use synonyms
energy
in the Use synonyms
last
Linking Words
year
. Use synonyms
Then
, nuclear Linking Words
had
generated 26.4 % of Unnecessary verb
apply
energy
and the Use synonyms
third
highest was Gas with a total Linking Words
amount
of 21.7 %. The other source didn’t generate much Use synonyms
electricity
. The minimum Use synonyms
energy
Use synonyms
was
generated was by Unnecessary verb
apply
oil
with a total Use synonyms
amount
of 4.0% of Use synonyms
energy
in the past years.
In conclusion, the above two Use synonyms
pie
graphs gave a brief explanation that Scotland had used the same sources of electric current and it had generated almost the same for the past years. Among all the different sources, Coal was the highest and Use synonyms
oil
was the lowest in generating Use synonyms
power
. Use synonyms
Moreover
, other Linking Words
resources
of Use synonyms
energy
Use synonyms
such
as Nuclear, Other renewables and Linking Words
oil
had increased their production in the Use synonyms
last
Linking Words
year
. Productivity Use synonyms
had
decreased Unnecessary verb
apply
last
Linking Words
year
compared to the Use synonyms
last
twenty years.Linking Words