
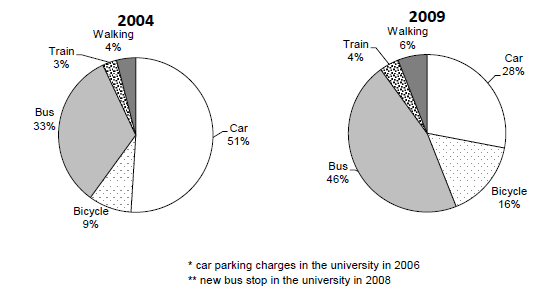
The given pie charts illustrate the proportion of means of transport namely
car
, bicycle, Use synonyms
bus
, Use synonyms
train
and walking, used to travel to a Use synonyms
university
in 2004 and 2009.
Use synonyms
Overall
, the figure for Linking Words
car
and Use synonyms
bus
made up the largest Use synonyms
number
of entire means of transport in both examined years Use synonyms
while
the Linking Words
number
of Use synonyms
people
travelling by Use synonyms
train
and on foot remained almost unchanged. Remarkably, riding to the Use synonyms
university
became more popular in 2009.
In 2004, 51% of Use synonyms
people
drive a Use synonyms
car
to the Use synonyms
university
in comparison with 33% going by Use synonyms
bus
. After five years, under the charges for Use synonyms
car
parking and the building of a new Use synonyms
bus
stop in the Use synonyms
university
, the figure for Use synonyms
car
travelling decreased by nearly a half, Use synonyms
whereas
the Linking Words
number
of Use synonyms
people
going to the Use synonyms
university
by Use synonyms
bus
increased by approximately 10%.
The figure for Use synonyms
train
passengers and Use synonyms
people
walking to the Use synonyms
university
in 2004 was 3% and 4% respectively. Noticeably, those figures were somewhat the same in 2009 with 4% for Use synonyms
train
and 6% for walking. There was a clear trend over the period of five years that more Use synonyms
people
preferred riding a bike to the Use synonyms
university
because the Use synonyms
number
of Use synonyms
people
travelling by bicycle in 2009 increased nearly double, compared to only 9% in 2004.Use synonyms