
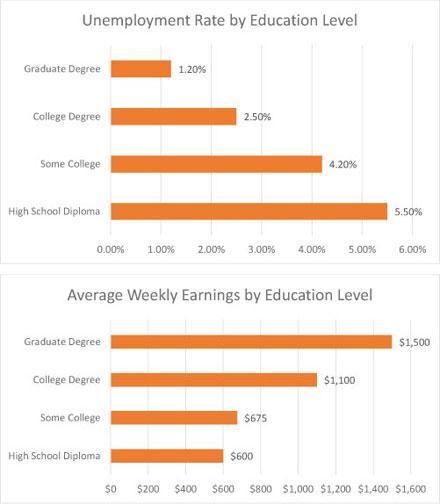
The bar charts illustrate the amount of
unemployment
and average earnings in four different education levels.
Use synonyms
Overall
, what is clear from the data is that graduate degree owners were the highest amount of Linking Words
money
earned, Use synonyms
while
that group had the least place in the Linking Words
unemployment
rate. Use synonyms
On the contrary
, Linking Words
while
the high school Linking Words
graduates
were in the first place, those earned the least Use synonyms
money
.
Focusing on the Use synonyms
unemployment
rate by education level, high school and some college Use synonyms
graduates
had the greatest and the Use synonyms
Linking Words
second greatest
rates in 2016 with 5.5% and 4.2%, respectively. Add a hyphen
second-greatest
However
, Graduate degree owners were the group that had the rock-bottom point in the Linking Words
unemployment
rate at 1.2%.
Use synonyms
On the other hand
, in average weekly earnings, in spite of the fact that high school Linking Words
graduates
earned the least Use synonyms
money
at 500 dollars, graduate degree owners earned the highest amount of Use synonyms
money
at 1500 dollars. Use synonyms
Also
, college Linking Words
graduates
were the Use synonyms
second
highest earners at 1100 dollars.Linking Words