
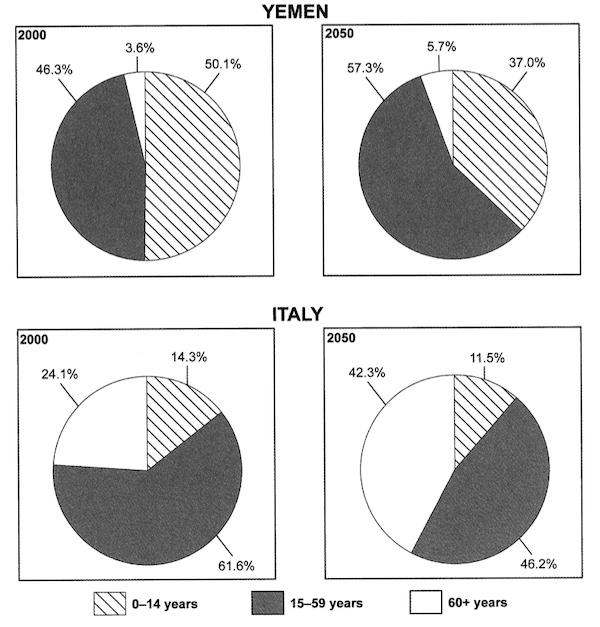
These pie charts illustrate us the common picture of the inhabitants of
Yemen
and Italy in the zeroes and make a prediction about the state of population in 2050. All charts consider thee groups of Use synonyms
people
: before 15, the Use synonyms
people
in a range from 15 till 59 and the oldest part is more than 60 year old.
First of all we can see that Use synonyms
Yemen
used to have the almost equal numbers of young and mature Use synonyms
people
in the beginning of the century, 46.3% and 50.1% concidreably. There were only a small amount of retired inhabitants, just 36%. Meanwhile, Italy had much less youngsters: only 14.3%, and Use synonyms
also
has a lot of Linking Words
people
who are older than 60.
The prediction is pretty clear: both of countries expects that older part of their inheritance will increase to 2050 and young part will be decreased simultaneously: Use synonyms
Yemen
will have 5.7%/37.0% of these groups of Use synonyms
people
Use synonyms
while
Italy will have much more olders: 42.3%/11.5%. Working-age population will be grew to 57.3% in Linking Words
Yemen
and drop to 46.2% in Italy.Use synonyms