
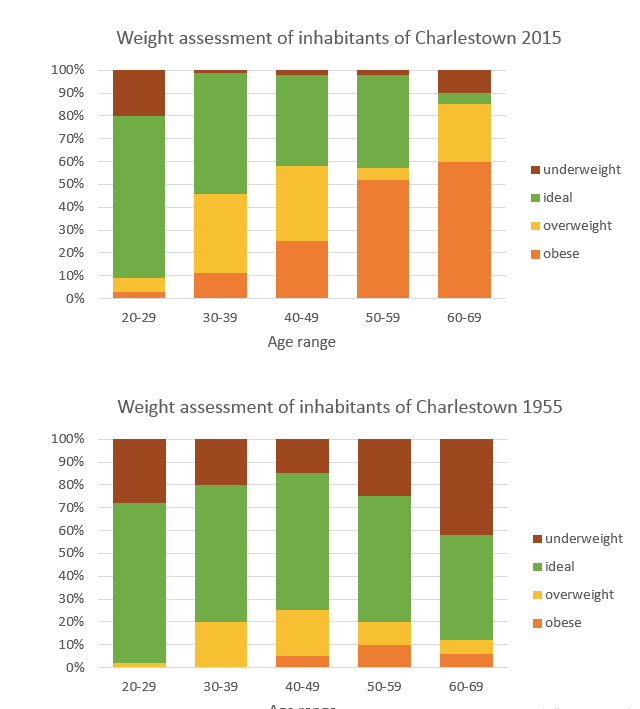
The two bar charts indicate an analysis of the very differences among the city dwellers of the town called Charlestown between 1955 and 2015.
Going into more detail, in 1955, the youngest life category had a minor number of health issues, with more than 70% of 20-29-year-olds being considered to have a healthy burden. In the same year, the crucial problem was excess weighting among 40-49-year-olds, 20-30% of whom were rated as overweight or obese. More than 20% of each age group suffered from being starved,
in particular
seniors, with 40% who were classified as malnourished.
In sharp contrast to Linking Words
this
, in 2015, only 2029-year-olds had a problem with having low weight with 20% having Linking Words
this
diagnosis Linking Words
while
the number of underrated elderly people plummeted to only 10%. Obesity constitutes considerable trouble from the life of 30 upward. In fact, there was a steady rise in Linking Words
this
issue in almost every maturity category from over 29 until the maturity of 60. It is important to mark that, by the maturity of 60, less than 50% of each age group was considered to have a perfect load by the year 2015. Linking Words
This
is a fall of 10% compared to the same age category in 1955.Linking Words