
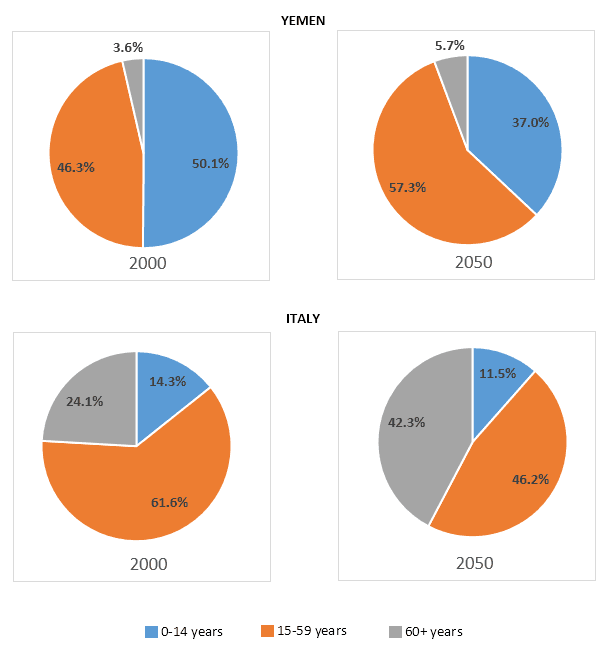
The pie charts illustrate the blend of the generation in Italy and Yemen in 2000,
in addition
, they Linking Words
also
make predictions about possible changes in 2050. Looking from an Linking Words
overall
perspective, in both countries, there is a tendency to shorten the Linking Words
number
of younger ones in the population.
When we analyzed data from 2000 in Yemen, first of all, we noticed that half of society was represented by children from 6 to 14 Use synonyms
years
old. Around 46.3 % were a group of 15 to 59 Use synonyms
years
, and the smallest Use synonyms
number
was shown by those who were over 60 Use synonyms
years
old. Use synonyms
This
country's projection is to increase the Linking Words
number
of elderly by approximately 5,7%. The vast majority, Use synonyms
according to
the info in the chart around 57.3%, will be represented by the group of adults and adolescents. At the same time, there will be a possibility of decreasing the Linking Words
number
of infants.
In Italy, in the past, we noticed that more than half were individuals between 15 to 59 Use synonyms
years
. Use synonyms
However
, we must admit that the Linking Words
number
of older people, which was around a quarter, was much more significant in comparison to those in Yemen. The tiniest part of the population in 2000 were children. The main prediction for 2050 is that there will be a tendency to increase the Use synonyms
number
of people over 60 Use synonyms
years
and a decline in the group of infants.Use synonyms