
The pie charts
illustrates
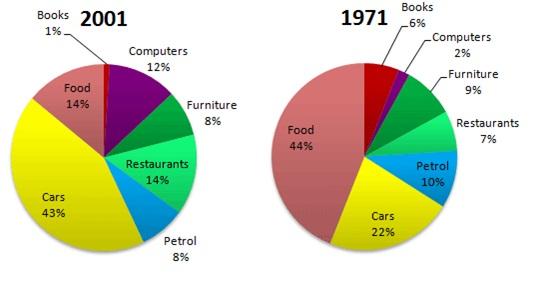
how much members of Britain spent on different items in the United Kingdom in the year 1972 and 2001. Change the verb form
illustrate
Overall
, in 1917, Linking Words
British
spent much on Correct article usage
the British
food
Use synonyms
while
in 2001, they used much on Cars.
The highest expenditure in 1971 in the United Kingdom was on Linking Words
food
with 44% Use synonyms
although
Linking Words
in
2001, Add the comma(s)
,in
Fourty
three Correct your spelling
Forty
percent
expense was on Cars Change the spelling
per cent
hence
being the only Linking Words
the only
two items that Remove the redundancy
apply
was
highly used. It is Change the verb form
were
also
observed that Linking Words
food
expenses in 1971 Use synonyms
was
two times higher than for Change the verb form
were
the
Cars. Correct article usage
apply
However
, in 2001 the British members spent three times more than what is utilized on Linking Words
food
( 43%, 14%) respectively. Petrol usage was 10% in the year 1971 which dropped by 2% in 2001 and Furniture expenditures stepped to 8% in 2001 from 9% in 1971.
The United Kingdom used to spend seven Use synonyms
percent
on restaurants in 1971, but later in 2001 it gradually increased Change the spelling
per cent
doubled
well as the expense of books declined steadily from 6% in 1971 to only 1% in the year 2001. Correct word choice
and doubled
Linking Words
Finally
the expenditure on Computers rose dramatically from just 2% to 12% in 2001.Add a comma
,Finally