
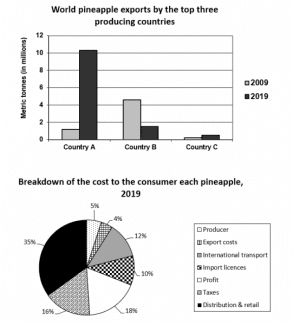
The bar chart illustrates the
amount
of pineapples exported by the top three pineapple-producing countries in 2009 and 2019, Change the quantifier
number
while
the pie graph displays the costs to the consumer of each pineapple in 2019. Linking Words
Overall
, pineapple exports from country A grew the most over the years. Linking Words
Besides
, distribution and retail were the most significant costs for pineapple consumers in 2019.
Country A exports have risen considerably from just around 1% of sales in 2009 and reached a peak of 10% of them in 2019. In country B, exports decreased sharply from more than 4 percentage points to less than 2%, Linking Words
while
sales remained relatively unchanged from less than 1%.
Linking Words
On the other hand
, in 2019 the highest cost to the consumer of Linking Words
this
fruit was distribution and retail at 35% and the next highest was taxes at 16%. Linking Words
In addition
, export costs accounted for only 4% of them, being the most expensive cost.Linking Words