
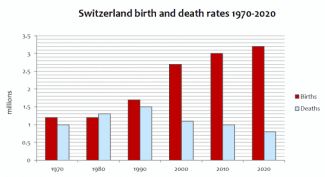
The bar chart illustrates how many babies were born and how many people died in Switzerland over a
period
of 50 years. The data was provided by United Nations and units are calculated in millions of people.
Use synonyms
Overall
, the number of births went up gradually from the beginning of the Linking Words
period
until 2020, Use synonyms
whereas
figures for deaths fluctuated throughout the given Linking Words
period
in question.
The chart demonstrates that in the first decade, 1970, childbirth stood at approximately 1.2 Use synonyms
million
until 1980 which was the lowest point of it during the given Use synonyms
period
. In comparison with natality rates, mortality rates increased substantially till 1990 (from 1 Use synonyms
million
to 1.5 Use synonyms
million
), Use synonyms
however
, the upward trend was broken in 2000. Linking Words
While
delivery numbers almost tripled Linking Words
at the end
of the given time, the count of passing people dipped considerably to reach about 0.75 Linking Words
million
. The death count was dominated by the birth count roughly in all decades.Use synonyms