
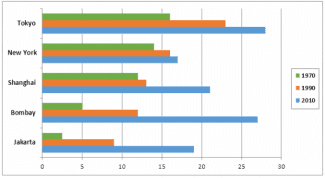
The bar graph and the table show the
population
growth in Use synonyms
five
metropolitan Use synonyms
cities
in the world. The bar graph shows the data from the year 1970 to 2010, Use synonyms
whereas
, the table provides the data from 1950 and 2010. Linking Words
Finally
, the line chart compares urban and rural world populations from 1980 to 2010.
It can be seen from both the bar graph and the table that Tokyo had a rapid jump in Linking Words
the
Correct article usage
apply
population
over the three decades (1970 to 2010), surpassing New York's Use synonyms
population
which took first place in the top Use synonyms
five
biggest Use synonyms
cities
' populations in 1950. Bombay's people Use synonyms
also
had a dramatic increase by Linking Words
five
times from 1970 to 2010, replacing London as the Use synonyms
second
highest Linking Words
population
. Following that, Jakarta's Use synonyms
population
Use synonyms
also
had a steep rise and was making it into the top Linking Words
five
of the biggest Use synonyms
cities
in 2010, Use synonyms
along with
Tokyo, Bombay, Lagos, and Shanghai.
The line chart shows that the figure of people living in urban areas is increasing gradually and the rural community is declining slightly. From 2004, it can be seen there was an overlap between the figures for urban and rural populations. Linking Words
This
Linking Words
also
notes the beginning of the growth and decline in the total of people living in the downtown and villages, respectively. It is expected that the growth of the Linking Words
population
in Use synonyms
cities
will rise even Use synonyms
further
over time.Linking Words