
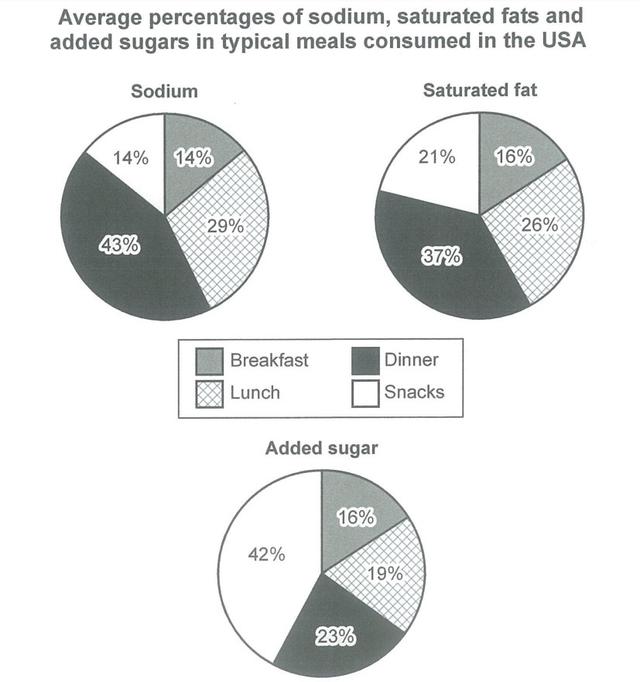
The pie chart illustrates the proportion of three types of nutrients people are consuming in each meal and in snakes in the USA. If individuals consumed too many nutrients it leads to being unhealthy.
Overall
, the information given that at the time of ,dinner person is consuming higher nutritions Linking Words
such
as Linking Words
sodium
, saturated fat and added Use synonyms
sugar
and the percentage is 43%, 37% and 23% respectively. Use synonyms
However
, it can be seen that breakfast contains the lowest amount of Linking Words
sodium
(14%), saturated fat (16%) and added Use synonyms
sugar
(16%).
The remaining two meals are lunch and snacks. As the ,eating the time of lunch 29% Use synonyms
sodium
, 26% saturated fat and 19% added Use synonyms
sugar
are consumed. ,Use synonyms
Linking Words
Finally
the snake ,time people take a higher percentage of added Add a comma
,Finally
sugar
42% compared to Use synonyms
sodium
consumes 14% and saturated fat includes 21%.
Use synonyms
Thus
, it is clearly visible from the pie charts that every typical meal consumed in the USA contains ả percentage of at least 14% of nutrients that can be unhealthy if eaten too much.Linking Words