
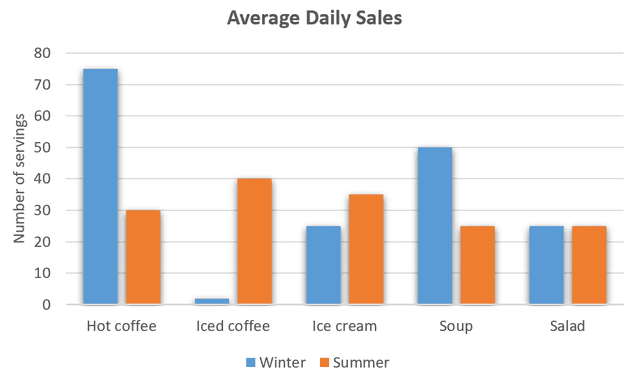
The bar graph shows how many
servings
of certain Use synonyms
food
items are sold on average every day in two different seasons at the Brisk Café. The average Use synonyms
number
of Use synonyms
sales
of each Use synonyms
item
changed with the season.
Certain Use synonyms
food
items had much higher Use synonyms
sales
than others in the winter. Hot Use synonyms
coffee
had the highest Use synonyms
number
of Use synonyms
sales
, with an average of 75 Use synonyms
servings
sold daily. Use synonyms
Following
Linking Words
this
, the Linking Words
item
with the second highest Use synonyms
number
of Use synonyms
sales
was soup, with an average of 50 Use synonyms
servings
sold daily. Salad and ice cream had average daily Use synonyms
sales
of 25 Use synonyms
servings
each, and iced Use synonyms
coffee
had the lowest Use synonyms
number
of Use synonyms
sales
, with close to zero Use synonyms
servings
sold daily.
The Use synonyms
sales
numbers for each Use synonyms
food
Use synonyms
item
were different in the summer from what they were in the winter. Iced Use synonyms
coffee
Use synonyms
sales
rose significantly, to an average of 40 Use synonyms
servings
sold daily. The Use synonyms
item
that had the second highest Use synonyms
number
of Use synonyms
sales
was ice cream, with an average of 35 Use synonyms
servings
sold daily. Hot Use synonyms
coffee
Use synonyms
sales
fell to just 30 Use synonyms
servings
daily. Soup and salad had the lowest Use synonyms
number
of Use synonyms
sales
, with 25 Use synonyms
servings
sold daily on average.
In general, the average daily Use synonyms
sales
of each Use synonyms
food
Use synonyms
item
changed when the season changed. Certain items were more popular in the winter, but certain others were more popular in the summer.Use synonyms