
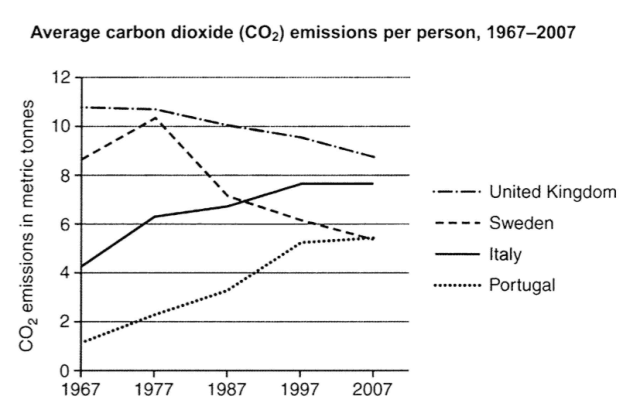
This
line graph provides information about the average carbon dioxide (CO2) emissions per person in four countries(the United Kingdom, Linking Words
Sweden
, Italy and Portugal) between 1967 and 2007.
Use synonyms
Overall
, Linking Words
it is clear that
the UK is the top emitter all the time, though it kept decreasing from 1967 to 2007. Linking Words
Similarly
, the figure for Linking Words
Sweden
decreased, except between 1967 to 1977. In the contrast, the emissions of CO2 from Italy and Portugal kept increasing.
CO2 emissions in the United Kingdom decreased from 11 metric Use synonyms
tonnes
in 1967 to 9 metric Use synonyms
tonnes
in 2007. After an increase from 9 metric Use synonyms
tonnes
in 1967 to a peak at over 10 metric Use synonyms
tonnes
in 1977, the CO2 of Use synonyms
Sweden
decreased to less than 6 metric Use synonyms
tonnes
in 2007, which was surpassed by Italy in 1987 and Portugal in 2007.
The figure for Italy and Portugal increased from more than 4 metric Use synonyms
tonnes
and 1 metric tonne in 1967 to more than 7 metric Use synonyms
tonnes
and 5 metric Use synonyms
tonnes
respectively in 1997, before levelling off until 2007. By the end of the given period, Italy took second place Use synonyms
instead
of Linking Words
Sweden
, and Portugal took third place, which had the top increase of the four countries.Use synonyms