
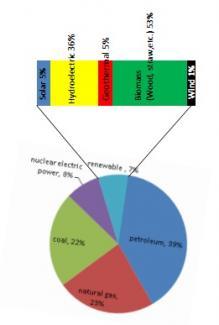
The graph provides information about the percentages of
energy
consumption worldwide in 2010. Use synonyms
Further
detail on five kinds of renewable Linking Words
energy
usage during the period is Use synonyms
also
presented.
Linking Words
Overall
, Linking Words
although
having been used globally in 2010, our reliance on renewable Linking Words
energy
still needs to be increased compared to the considerable expenditure on fossil fuels.
Considering its 39% contribution, petroleum was the largest segment of all Use synonyms
energy
used in 2010, followed by almost a quarter of natural gas during the same period. Having accounted for only 22%, coal was the least among all the unclean energies provided in the pie chart.
In terms of green Use synonyms
energy
, in 2010, nuclear power made up 8% of the total Use synonyms
energy
consumed by the world. It is 1% higher than renewable Use synonyms
energy
. Biomass and hydropower were the top two of all renewable energies depicted in the figure, with 53% and 36% contributions, respectively. Use synonyms
On the other hand
, geothermal, solar cells, and wind only supply below 10% of 7% renewable power throughout the year.Linking Words