
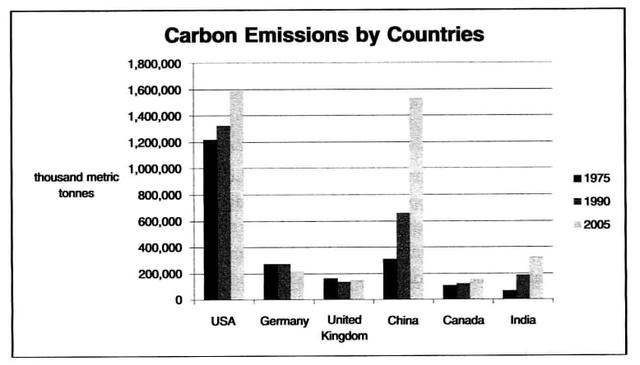
The bar graph depicts the number of carbon emissions which
is
categorized Correct subject-verb agreement
are
to
six different nations. The report surveyed in 1975, 1990 and 2005.
In general, all of the Change preposition
into
country
have Change to a plural noun
countries
positive
trend Correct article usage
a positive
year
by Use synonyms
year
, Use synonyms
whereas
only data in Germany stabilized and had a downward tendency in the Linking Words
last
Linking Words
year
.
In detail, in Use synonyms
USA
, the proportion of carbon Correct article usage
the USA
emission
increased sharply from approximately 12000000 to 16000000 metric tonnes in the Fix the agreement mistake
emissions
last
period. Linking Words
Similarly
, China followed a similar pattern Linking Words
with
Change preposition
to
USA
, which increased significantly from around 300000 to 700000 in the following Correct article usage
the USA
year
, Use synonyms
then
continued to Linking Words
had
a gradual rose until 15000000 in 2005. The United Kingdom, Canada, and India, Change the verb
have
also
accumulated carbon emissions over time between 1975 and 2005. Linking Words
In addition
, the lowest amount of emission in 1975 was India which showed 1500000, Linking Words
while
the highest emission for all of the period was Linking Words
USA
.
Correct article usage
the USA
On the other hand
, only Germany's report Linking Words
that
has Correct pronoun usage
apply
the
contrast pattern. In 1975, the survey indicated 2500000, Correct article usage
a
then
experienced fairly remained unchanged in 1990. Unfortunately, Linking Words
this
trend did not Linking Words
last
long and began to worsen in 2005 until 1750000 metric tonnes.Linking Words