
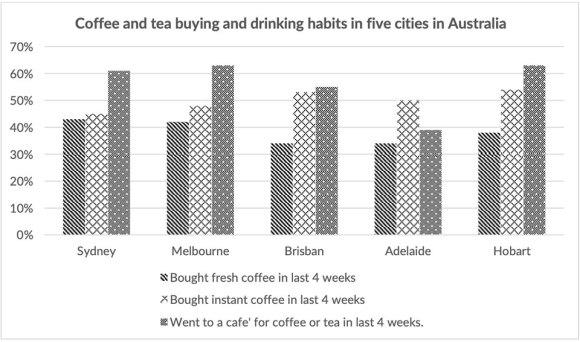
The bar chart gives a comparison of purchasing and drinking habits of
coffee
and tea in five different cities in Australia in recent Use synonyms
last
four weeks time frame.
As is observed, Australians tend to have their Linking Words
coffee
or tea in a cafe more than just buying it from Use synonyms
coffee
houses. Use synonyms
Moreover
, they are inclined to buy instant Linking Words
coffee
more than fresh ones.
The highest number for having Use synonyms
coffee
or tea in a cafe is accounted for the Hobart and Melbourne people, both with around 64 per cent. Use synonyms
Following
Linking Words
this
, Sydney ranks the second highest amount with almost 61%. Linking Words
While
Hobart is the highest amount for taking instant Linking Words
coffee
from a Use synonyms
coffee
house, Brisbane ranked the second highest figure for it.
Regarding the figures for giving information about purchasing fresh Use synonyms
coffee
, Sydney and Melbourne recorded the highest percentage with just about 44% and roughly 43 per cent respectively. Use synonyms
Consequently
, Brisbane's proportion for Linking Words
this
figure is slightly under 35 per cent.Linking Words