
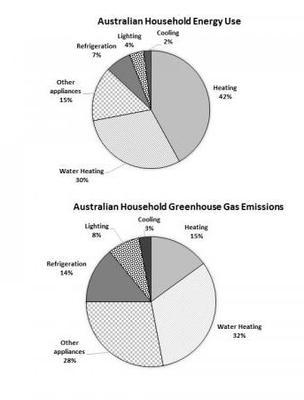
The pie charts illustrate the portion of the
energy
used by an Australian, Use synonyms
while
the second pie chart shows the average Linking Words
emissions
of greenhouse Use synonyms
gas
.
Use synonyms
Overall
, Linking Words
it is clear that
in Linking Words
both
charts heating held the most percentage ,especially in the usage of Use synonyms
energy
.
Regarding the first pie chart, heating accounted for just under Use synonyms
a
half; 42 per cent, the greatest proportion. Correct article usage
apply
This
is Linking Words
while
heating made up only a fifth of total greenhouse Linking Words
gas
Use synonyms
emissions
. Use synonyms
Moreover
, the proportion of water heating in Linking Words
both
is approximately close. The corresponding figure for Use synonyms
energy
use is almost a third and for Use synonyms
gas
is a growth of 2 per cent; 32%. Use synonyms
In addition
, the usage of Linking Words
energy
for refrigeration and lighting, are Use synonyms
both
less effective than the figure for Use synonyms
gas
Use synonyms
emissions
. Use synonyms
also
, other factors play an important role in the greenhouse Linking Words
gas
percentage with 28%, Use synonyms
whereas
it makes up only 15% of the usage of Linking Words
energy
. Use synonyms
According to
the data, it is noticeable to mention that in Linking Words
both
charts, the least percentage is held by cooking with only one person difference, with more impacts on Use synonyms
gas
Use synonyms
emissions
.Use synonyms