
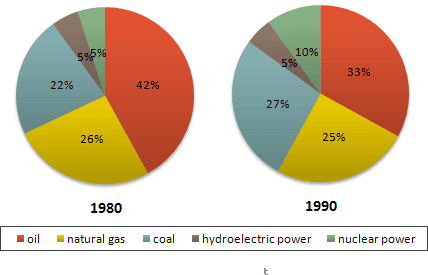
The provided two pie charts demonstrate the proportion of sources of five energy in the USA over a decade
period
from the years 1980 to 1990.
Use synonyms
Overall
, it can be clearly seen that oil is the highest approximately both 42 and 33 per Linking Words
cent
Use synonyms
period
between the years 1980 and 1990. Coal is adequate at 22 per Use synonyms
cent
Use synonyms
nevertheless
it is an increased on at 27 per Linking Words
cent
. Use synonyms
Furthermore
natural gas gains approximately 26 per Linking Words
cent
next to decline slowly by 25 per Use synonyms
cent
. Both hydroelectric and nuclear power the minor approximately 5 per Use synonyms
cent
. The 10 per Use synonyms
cent
is raised by nuclear power Use synonyms
nonetheless
hydroelectric is staged about 5 per Linking Words
cent
Use synonyms
period
a decade year.
In conclusion, the two pie graphs indicate the percentage of sources of five energy that oil is a significant Use synonyms
period
from the years 1980 to 1990. Use synonyms
However
coal and natural gas are adequate regularly the minor is hydroelectric Linking Words
as well as
Linking Words
a
nuclear power.Correct article usage
apply