
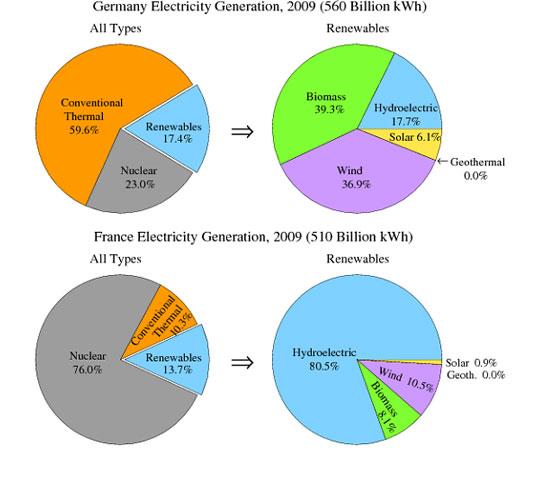
The pie chart provides information on the percentages of
electricity
produced from various Use synonyms
sources
and renewables in 2009 in two European countries.
Looking from an Use synonyms
overall
perspective,Germany generated 560 billion kWh and France produced 510 billion kWh of Linking Words
electricity
in 2009.In ,Germany conventional thermal Use synonyms
sources
contributed the highest to Use synonyms
production
Use synonyms
whereas
,in France,Nuclear power supplied the maximum Linking Words
electricity
.
Use synonyms
To begin
,Out of 560 billion kWh of Linking Words
electricity
produced in Germany,59.6% was generated using conventional thermal Use synonyms
sources
and nuclear energy Use synonyms
sources
donated 23 % to the Use synonyms
overall
Linking Words
production
.17.4 % of the Use synonyms
electricity
is generated using renewables Biomass was used for more than one-third of the total Use synonyms
production
and wind energy is utilized for 36.9 % which is six times higher than solar energy. Less than one-fifth was used from the hydroelectric Use synonyms
sources
.
Use synonyms
However
,76 % of the Linking Words
electricity
generated in France was from Nuclear Use synonyms
sources
and only 10.3% was contributed by conventional thermal Use synonyms
sources
.13.7% of Use synonyms
electricity
was produced by renewables with four out of five from hydroelectric Use synonyms
sources
and wind 10.5%.Biomass was used for less than 10% of Use synonyms
electricity
Use synonyms
production
and solar contributed a negligible percentage.Use synonyms