
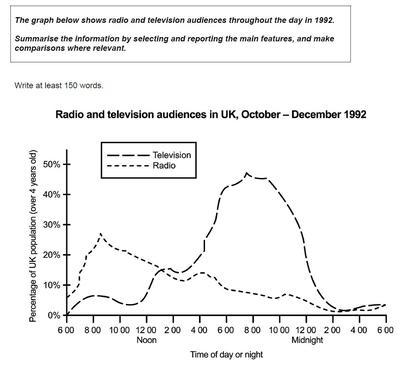
The provided line graph, illustrates the percentages of TV and
radio
audiences in the United Kingdom, throughout the day in 1992.
Use synonyms
Overall
, the number of people who watch television was higher most of the time, especially in the evening hours.
Around 1 AM, more than 5% of the UK population watched TV, and nearly 3% listened to the Linking Words
radio
. Following two hours, less than 5 per cent of people are occupied with both media. After 7:00 in the morning, Use synonyms
radio
listeners rose to 25% significantly, Use synonyms
whereas
TV users remained at 5 per cent. Linking Words
Furthermore
, at 1300 hours Linking Words
radio
users fell to 15%, Use synonyms
while
television users increased to 15%.
Linking Words
Moreover
, the proportion of folks who watch television gradually incremented over time and reached a peak of 45% during the 9:00 PM and witnessed a sudden drop after 11:30 PM. Linking Words
On the other hand
, Linking Words
radio
listners slowly decreased from 1 PM to 11.30 PM and met a low of 5%.Use synonyms