
This
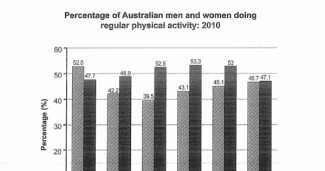
bar chart shows the proportion of Linking Words
men
and Use synonyms
women
of various ages who often exercised in Australia in 2010. Use synonyms
Overall
, the data shows that both Linking Words
men
and Use synonyms
women
tend to be more physically active than young adults, but Use synonyms
women
over 45 engage in more physical Use synonyms
activity
than younger Use synonyms
women
.
In 2010, more than half of Australian Use synonyms
men
(53%) and Use synonyms
women
(47%) aged 15 to 24 participated in regular physical Use synonyms
activity
. Use synonyms
While
Linking Words
women
engaged in similar Use synonyms
activity
levels between the ages of 25 and 44, Use synonyms
men
's Use synonyms
activity
levels dropped dramatically beyond that age. Just 39.5% of Use synonyms
men
aged 35 to 44 participated in regular exercise, Use synonyms
whereas
a much higher percentage of Linking Words
women
in the same age group (52.5%) regularly exercise.
Use synonyms
On the other hand
, Linking Words
women
accounted for almost 53 per cent of the group comprising adults aged 45 to 54. Use synonyms
Although
females aged 35 to 64 had a higher participation rate in sports training than teens, the disparities between teens and Linking Words
the
most senior adults were less than 1%.Correct article usage
apply