
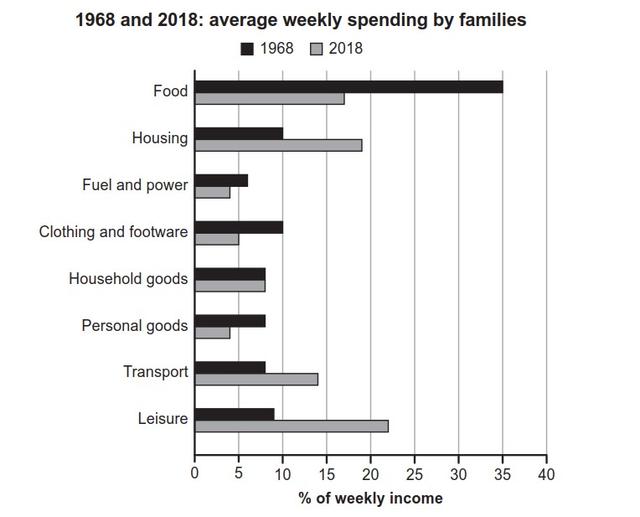
The bar chart illustrates data about average weekly expenditures on 8 various usages of families from their salaries in a certain country in 1968 and 2018.
It is obvious that individuals tend to spend more money on food compared with other usages in 1968, which was at 35%,
whereas
, Linking Words
this
number fell significantly to about 17% after four decades. Linking Words
Thus
, people's consumption of household Linking Words
goods
which were afforded by weekly income remained constant for 40 years at about 8%.
Now, focus on the details, the expenditure on housing, transport, and free time increased noticeably more than before, Use synonyms
while
the figures which represent grocery, electricity, and personal Linking Words
goods
increased. People's usage of transport doubled to roughly 14% from 7%. Use synonyms
On the contrary
, the percentage of personal Linking Words
goods
and clothing and footwear usage decreased 2 times less to 4%. Use synonyms
Moreover
, fuel and power usage declined slightly, Linking Words
while
leisure expenditure jumped more than two times from 9% to 22%.
Linking Words
To sum up
, it is obvious that the spending on various factors changed considerably except for household Linking Words
goods
.Use synonyms