
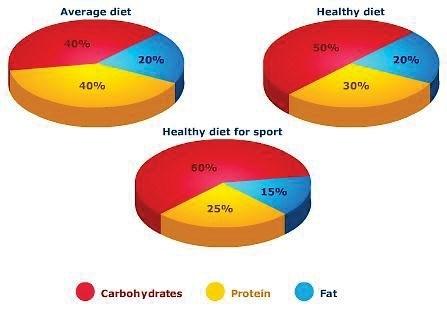
The given pie charts compare the percentage of three different nutrient elements in average, healthy and sports diets.
Overall
, carbohydrates take up the majority proportion in healthy and fitness diets. Linking Words
While
carbs and protein are equally consumed in a regular Linking Words
diet
. Use synonyms
In contrast
, fat has the least percentage in all the food plans
Looking at the information in detail, a fitness Linking Words
diet
distributes carbs as the major nutrient by 60%. Use synonyms
This
is 10% higher than healthy-based meals and 20% more than it is in a regular Linking Words
diet
. Use synonyms
Furthermore
, protein comes in the second proportion in the Linking Words
diet
of sports people with 25% . Which is 5% and 15% lower than it is in a healthy and regular Use synonyms
diet
.
Comparing the amount of fat consumed by the three plans, it has the same number in an average and healthy Use synonyms
diet
with 20% of fat. Use synonyms
However
, fit people eat only 15% of fat in their daily Linking Words
diet
.Use synonyms