
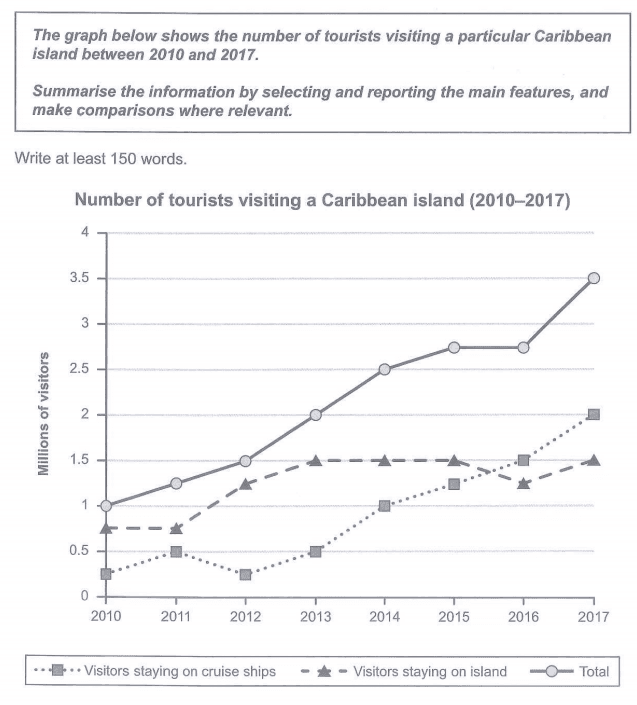
The given graph illustrates how many tourists were visiting a certain Caribbean island from 2010 to 2017. Units are measured in millions.
Overall
, it can clearly be seen that the Linking Words
number
of Use synonyms
visitors
rose throughout the given period.
In terms of the tourists with the highest level of visiting the island at the start, the Use synonyms
number
of Use synonyms
visitors
staying on the island stood at 0.75 in 2010. The guests Use synonyms
then
experienced a significant climb to 1.5 and stayed constant until 2015 before dropping slightly by 0.5 in 2016 and increasing again to 1.5 in the final year. Linking Words
On the other hand
, the Linking Words
number
of Use synonyms
visitors
with the lower level staying on cruise ships started at 0.25 in the beginning. The Use synonyms
visitors
Use synonyms
then
witnessed a slight incline to 0.5 exactly in 2011 before dropping to the beginning Linking Words
number
in 2012. It rose dramatically and reached a peak of 2 in the final year.
Regarding the total Use synonyms
number
of travellers, it started at 1 and saw a dramatic growth to almost 2.75 in 2015 and remained steady until 2016 before peaking at 3.5 exactly Use synonyms
at the end
of the period.Linking Words