
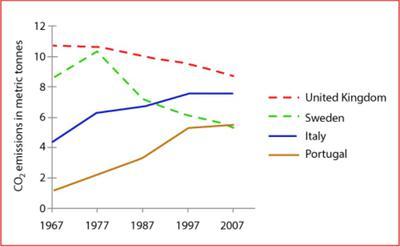
The provided line chart
illustrate
Change the verb form
illustrates
figures
in terms of CO2 Use synonyms
emmisions
per person in four European countries (the UK,Correct your spelling
emissions
Sweden
,Italy and Portugal) from 1967 to 2007. Use synonyms
Figures
are measured in metric Use synonyms
tonnes
.
Use synonyms
Overall
, Portugal and Italy Linking Words
were
increased their emissions of carbon dioxide over the time period, Unnecessary verb
apply
while
the United Kingdom and Linking Words
Sweden
were Use synonyms
abled
to reduce their CO2 Replace the word
able
emmissions
. Correct your spelling
emissions
Although
Linking Words
,
the Remove the comma
apply
figures
Use synonyms
of
Change preposition
for
Sweden
and Portugal had Use synonyms
significant
Add an article
a significant
difference
in 1967, it has reached Fix the agreement mistake
differences
to
the same level in the year 2007. Change preposition
apply
Besides
, the most CO2 emission was from the UK Linking Words
according to
the graph.
Portugal and Italy started at around 1 and 4 metric Linking Words
tonnes
of carbon dioxide respectively in the year Use synonyms
of
1967 and rose in the following decades. Portugal witnessed Change preposition
apply
a
steady growth until 1987 and reached approximately 3.5 metric Correct article usage
apply
tonnes
before Use synonyms
climbed
to 4.5 metric Wrong verb form
climbing
tonnes
in 1997, Use synonyms
while
Italy experienced a small fluctuation Linking Words
during
1967 to 19997 and accounted for roughly 9.5 Change preposition
from
metic
Correct your spelling
metric
tonnes
of CO2. Use synonyms
However
, in the Linking Words
last
decade(1997-2007) both Italy and Portugal remained at the same Linking Words
figures
of approximately 9.5 and 4.5 metric Use synonyms
tonnes
respectively.
Use synonyms
On the other hand
, the UK showed the highest of 11 Linking Words
MT
in 1967 and declined during the period and reached the lowest of 9MT in 207. Use synonyms
Finally
, Linking Words
Sweden
began at 9MT of CO2 in 1967 and climbed significantly in 1997 to reach the peak of 11MT and dropped to 5MT in 2007, which was the same amount of CO2 that Portugal released in 2007.Use synonyms