
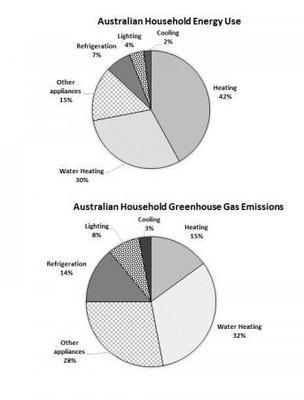
There are two charts that demonstrate the
houshold
Correct your spelling
household
energy
Use synonyms
use
and the Use synonyms
greenhouse
Use synonyms
gas
emissions in Australia at the same time which Use synonyms
energy
Use synonyms
use
chart leads to Use synonyms
greenhouse
Use synonyms
gas
.
Generally, there are five categories for household Use synonyms
energy
consumption that there are heating and cooling, Use synonyms
waterheating
, refrigeration, lighting and other appliances. among them the most consumption of Correct your spelling
water heating
energy
Use synonyms
use
is in Use synonyms
first
category (heating and cooling). Add an article
the first
However
, Linking Words
this
category Linking Words
produce
Change the verb form
produces
less
Change the quantifier
fewer
greenhouse
gases.
About 74% of Use synonyms
energy
uses include heating and cooling and water heating that water heating Use synonyms
produce
Change the verb form
produces
one third
of Add a hyphen
one-third
gas
emissions. Use synonyms
Although
, Linking Words
this
ratio for cooling and heating is about under 20%.
For two other categories that Linking Words
use
Use synonyms
energy
, refrigeration and lighting, they Use synonyms
use
less than 10% for each of them. But, they produce double Use synonyms
greenhouse
gases 14% and 8% respectively. Use synonyms
Moreover
, Linking Words
this
ratio is included for other Linking Words
applances
that 15% Correct your spelling
appliances
people
Change preposition
of people
use
it but 28% produce Use synonyms
greenhouse
Use synonyms
gas
.Use synonyms