
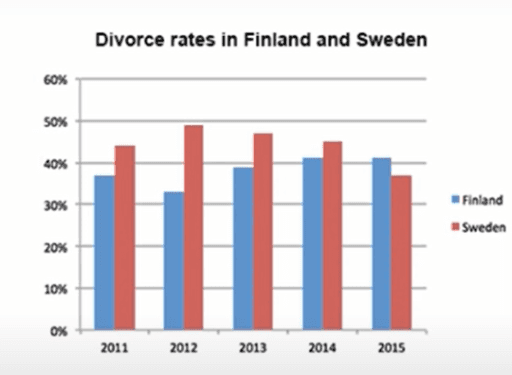
The bar chart illustrates the percentage of
divorce
in Use synonyms
Finland
and Use synonyms
Sweden
from 2011 to 2015.
Use synonyms
Overall
, Linking Words
Sweden
witnessed a downward trend in the Use synonyms
divorce
Use synonyms
rate
, as opposed to an increase in the figure for Use synonyms
Finland
from 2011 to 2015.
As can be inferred from the chart, it is evident that there was a slight growth in the percentage of Use synonyms
divorce
in Use synonyms
Sweden
between 2011 and 2012, with a 6% rise from 43% to 49%. In Use synonyms
Sweden
, the Use synonyms
divorce
Use synonyms
rate
stood at 49% in 2012, followed by an 11% decrease to the lowest Use synonyms
rate
at only 38% in 2015.
The percentage of Use synonyms
divorce
in Use synonyms
Finland
tended to fluctuate from 2011 to 2013. From 2011 to 2012, there was a 6% rise from 43% to 49% and it reached the highest Use synonyms
rate
at 49%, after which Use synonyms
this
figure increased sustainably, about 8% from 2012 to 2014. Meanwhile, the Linking Words
divorce
in Use synonyms
Finland
remained unchanged Use synonyms
rate
from 2014 to 2015, at 41% over the given time span.Use synonyms