
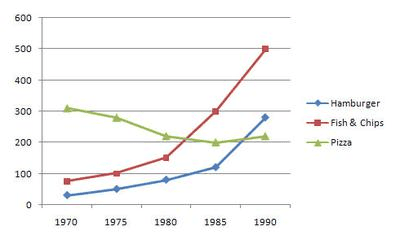
The line graph shows the demand for some junk meals in the UK from 1970 to 1990. clearly can be seen that over the years the consumption of both hamburgers and fish and fries was increasing among the UK citizens.
According to
the given data, 1970 was the least popular Linking Words
food
that people asked for with only 20 Use synonyms
grams
. The demand for burgers had a gradual rise over the years until it became the second favourite Use synonyms
food
in 1990 when it reached around 2 90 Use synonyms
grams
. Use synonyms
Furthermore
, fish and chips accounted for a considerable reduction with only 9th Linking Words
grams
in the beginning before they jumped to 500 Use synonyms
grams
Use synonyms
at the end
of the period and the asking for that type of Linking Words
food
made it the most popular one in 1990. Unlike the previous figures, pizza was the first Use synonyms
food
in the mandi among Britain people in 1970, Use synonyms
however
, it witnessed a noticeable shrink from 300 to 200 Linking Words
grams
Use synonyms
at the end
of the year when pizza became the third one.
Linking Words
Overall
, there was a substantial change in the consumption of the favourite fast Linking Words
food
in The UK over the yearsUse synonyms